


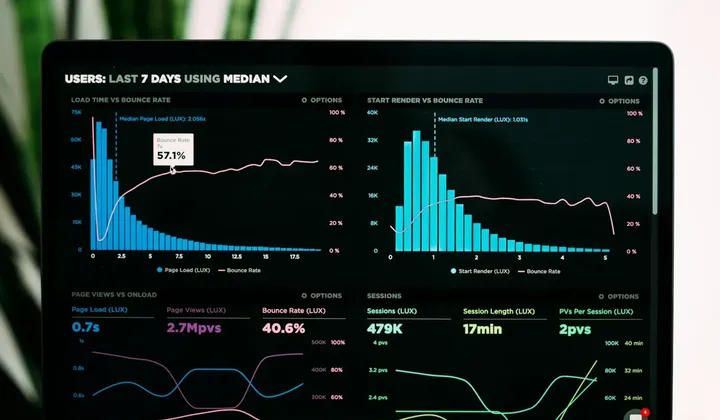
Sales Intelligence Dashboard

This product concept defines a path from CSV and Excel sales exports to daily, weekly and monthly dashboards. Column mappings require user approval before calculation, and metrics are designed to remain traceable to source rows. Time trends and product views help teams investigate sales questions. The product is at the design stage; demonstration scope, release readiness and deployment arrangements must be reviewed before operational use.

Intelligent Sales Dashboard

Configurable product

Intelligent Sales Dashboard

Turns approved CSV or XLSX mappings into traceable daily, weekly and monthly sales dashboards

Request an assessment

Capabilities

From fragmented data to a reviewable recommendation

Each capability connects to a management need and action path

Upload CSV and XLSX files and preview their contents safely

Upload CSV and XLSX files and preview their contents safely

Preview the file structure and sample rows before calculation. Column names, value types and obvious inconsistencies should be reviewable so the user can select the right export and identify initial data issues before continuing through the proposed workflow.

Request an assessment

Map columns through a guided flow and require explicit approval before calculation

Map columns through a guided flow and require explicit approval before calculation

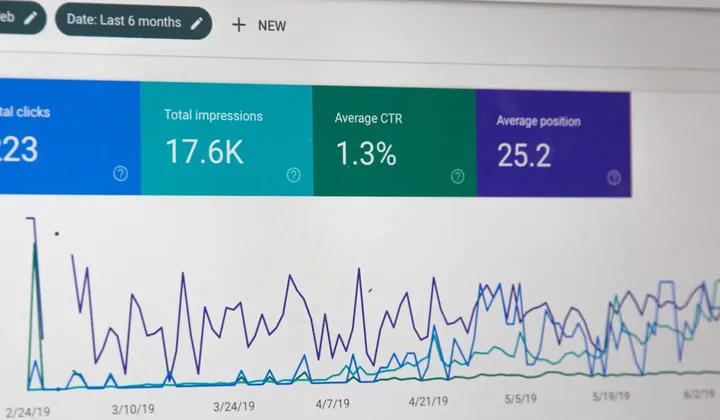
Use a guided flow to identify date, amount and product columns. User approval is required before calculation. Keep mapping changes visible so an incorrect interpretation of a source column does not become an apparently valid dashboard metric.

Request an assessment
Calculate daily, weekly and monthly sales views plus product and time patterns

Calculate daily, weekly and monthly sales views plus product and time patterns

Build time and product views from approved definitions. Make comparison periods, filters and metric logic visible. Sales leaders can then investigate a change in trend and pursue the next question with a clear understanding of the selected data.

Request an assessment
Trace dashboard calculations back to the source rows for review and audit

Trace dashboard calculations back to the source rows for review and audit

Keep each metric traceable to the rows used in its calculation. Showing the source, filters and approved mapping helps a reviewer investigate a discrepancy. Corrections can then be discussed using the underlying evidence and the calculation context.

Request an assessment

Our process

Assess, pilot and deploy in stages

Product scope expands after value and feasibility are tested

Discover

Understand the context

Clarify the decision, stakeholders, constraints and current data. Review a sample report and one recurring decision with its accountable owners.

Output: A shared problem frame
Prioritize

Select the opportunity

Compare options by value, feasibility and risk. Record assumptions, dependencies and the reasoning behind each priority for review.

Output: A prioritized opportunity portfolio
Shape

Design the path

Define architecture, delivery method and continue-or-stop criteria. Include required sources, responsibilities and control points in the delivery plan.

Output: An executable roadmap
Pilot

Test in real work

Evaluate a bounded slice in a real workflow with real users. Compare results with a baseline and consider test limitations in the next decision.

Output: Decision-grade evidence
Scale

Operate and transfer

Complete controls, monitoring and capability transfer with your team. Transfer documentation, monitoring ownership and an incident path to the operating team.

Output: An owned operational solution

Who it supports

The right information for the decision owner

Outputs must fit the user's language, timing and accountability

Owners and sales leaders in small and medium-sized businesses

Owners and sales leaders in small and medium-sized businesses

For "Owners and sales leaders in small and medium-sized businesses", the "Sales Intelligence Dashboard" experience adapts its detail, metrics and actions to the responsibilities of that role

Teams that prepare sales reporting from CSV or Excel exports

Teams that prepare sales reporting from CSV or Excel exports

For "Teams that prepare sales reporting from CSV or Excel exports", the "Sales Intelligence Dashboard" experience adapts its detail, metrics and actions to the responsibilities of that role

Decision-makers who need to trace every metric back to source rows

Decision-makers who need to trace every metric back to source rows

For "Decision-makers who need to trace every metric back to source rows", the "Sales Intelligence Dashboard" experience adapts its detail, metrics and actions to the responsibilities of that role

AI supports the decision; the accountable owner retains control

Control and ownership

AI supports the decision; the accountable owner retains control

Data ownership, access, decision records and quality monitoring are part of product design

Request an assessment

Next step

Could this product fit your need?

Describe the workflow and available data so an assessment scope can be defined