


Demand and input volatility
In "Manufacturing & supply chain", the pressure "Demand and input volatility" is assessed through its direct effect on daily decisions, workflow and input data
Demand, capacity, quality and inventory decisions depend on a connected view of sales, production and supply. Bringing these sources together helps teams investigate bottlenecks and differences between the plan and actual operations. Potential applications include demand forecasting, maintenance prioritization, quality analysis and inventory planning. Each application is assessed against available data, plant constraints and the responsibilities of the people who will act on it.

Industry context
Daily choices about demand, capacity, quality and inventory require connected data
Assess the opportunityDecision pressures
Clarify the real bottleneck and constraints before selecting a solution
In "Manufacturing & supply chain", the pressure "Demand and input volatility" is assessed through its direct effect on daily decisions, workflow and input data
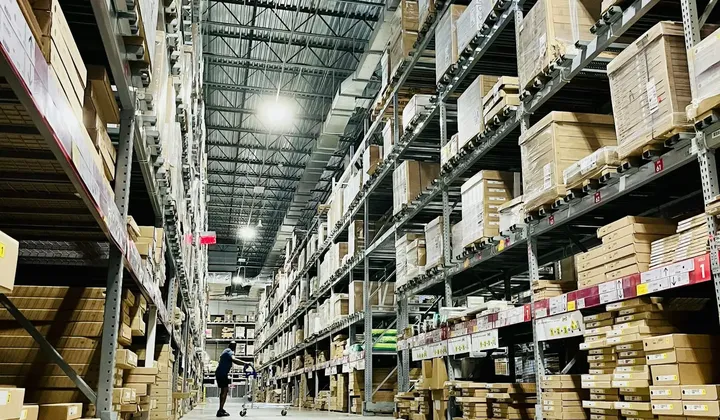
In "Manufacturing & supply chain", the pressure "Downtime and waste" is assessed through its direct effect on daily decisions, workflow and input data

In "Manufacturing & supply chain", the pressure "Fragmented plant and sales data" is assessed through its direct effect on daily decisions, workflow and input data
Practical opportunities
This list starts the conversation; it is not one prescription for every business

Examine orders and sales alongside seasonality, supply constraints and production plans. Compare forecasts with a baseline and assess their errors in inventory or capacity decisions. Planners can then understand when the output is useful and where additional judgment is needed.
Assess the opportunity
Review failure histories, maintenance records and equipment conditions for useful patterns. Assess alerts against the maintenance team’s response time and downtime implications. Operations retains repair priorities, while insufficient evidence and data gaps are made visible in the evaluation.
Assess the opportunity
Consider demand, lead times and service expectations alongside working-capital and storage constraints. Compare ordering and safety-stock options across scenarios. Make assumptions visible so replenishment decisions can be reviewed when supply or demand conditions change.
Assess the opportunity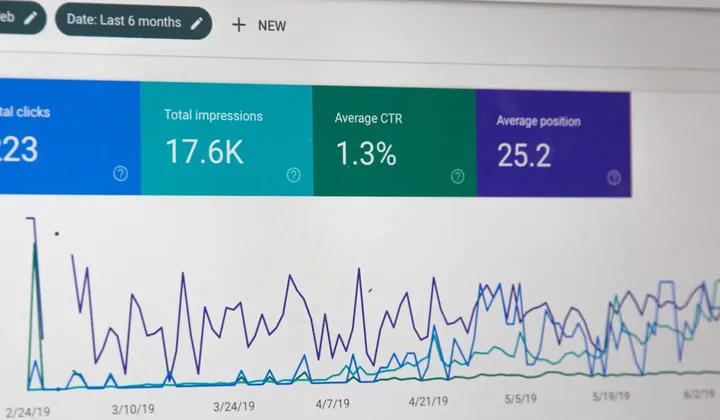
Connect test results, product specifications and production conditions through traceability. Use patterns to prioritize investigation of possible causes. Evaluate process changes with evidence and quality-owner review, keeping the distinction between an observed association and a confirmed cause clear.
Assess the opportunityOur process
Industry constraints inform every stage
Clarify the decision, stakeholders, constraints and current data. Review a sample report and one recurring decision with its accountable owners.
Output: A shared problem frameCompare options by value, feasibility and risk. Record assumptions, dependencies and the reasoning behind each priority for review.
Output: A prioritized opportunity portfolioDefine architecture, delivery method and continue-or-stop criteria. Include required sources, responsibilities and control points in the delivery plan.
Output: An executable roadmapEvaluate a bounded slice in a real workflow with real users. Compare results with a baseline and consider test limitations in the next decision.
Output: Decision-grade evidenceComplete controls, monitoring and capability transfer with your team. Transfer documentation, monitoring ownership and an incident path to the operating team.
Output: An owned operational solution
Starting point
That decision can reveal the required path for data, analytics or AI
Assess the opportunity